


The Data Science workflow is the backbone of every successful data project. Whether you are predicting customer behavior, analyzing medical records, or building recommendation systems, each project follows a structured sequence of steps that ensures accuracy, reliability, and real-world impact.
This article—part of our Data Science Lecture Series—explains the entire Data Science workflow, from understanding the problem to deploying and monitoring the final model.
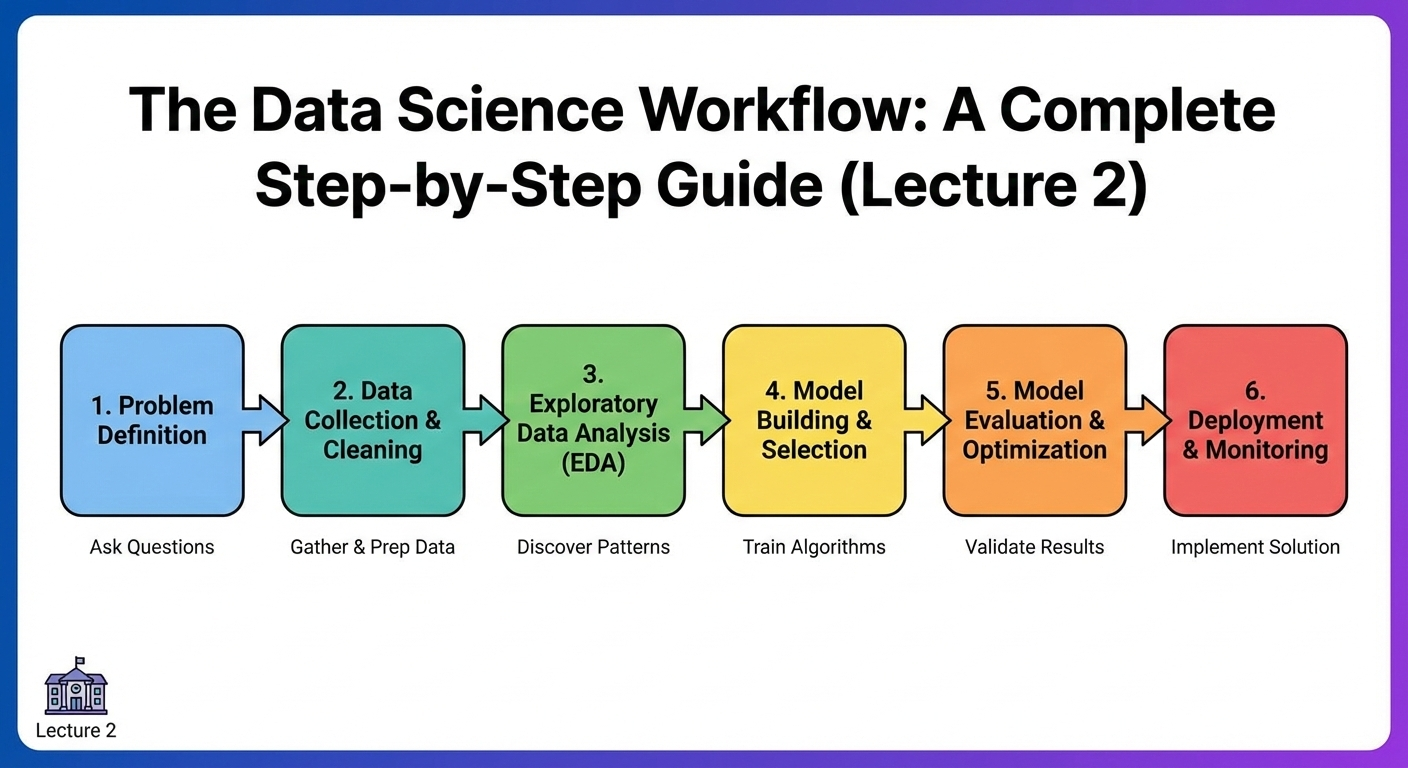
What Is the Data Science Workflow?
The Data Science workflow is a systematic process that guides how data scientists approach, analyze, and solve problems using data. It acts as a roadmap for transforming raw, unstructured information into meaningful insights and predictive models.
No matter the industry or use case, the workflow typically follows nine essential steps.
1. Problem Definition
Every Data Science project begins with a clear understanding of the business or research problem.
Key Questions to Ask
- What problem are we trying to solve?
- Why does it matter?
- What decisions will be based on our analysis?
- What does success look like?
Example:
An e-commerce company wants to predict which customers are likely to stop buying (customer churn prediction).
2. Data Collection
Once the problem is defined, the next step is gathering relevant data.
Common Data Sources
- Databases (SQL, NoSQL)
- APIs
- Web scraping
- Surveys & reports
- Public datasets (Kaggle, UCI, Google Datasets)
- Logs and user activity data
The goal is to collect accurate, sufficient, and relevant data.
3. Data Cleaning & Preparation
Raw data is often messy. It may contain missing values, duplicates, inconsistent formatting, or outliers. Data cleaning ensures the dataset is ready for analysis.
Cleaning Tasks Include:
- Handling missing values
- Removing duplicates
- Fixing inconsistencies (date formats, text formats)
- Treating outliers
- Encoding categorical data
- Normalizing or standardizing numerical data
Note:
Data cleaning typically takes 50–70% of a data scientist’s time—it’s that important.
4. Exploratory Data Analysis (EDA)
EDA is the step where you explore the data to understand patterns, trends, and relationships.
EDA Involves:
- Summary statistics
- Data visualization
- Correlation analysis
- Identifying patterns or anomalies
- Generating questions or hypotheses
Common Tools
- Pandas
- NumPy
- Matplotlib
- Seaborn
Example Insight:
Customers with low monthly usage and frequent complaints are more likely to churn.
5. Feature Engineering
Feature engineering involves creating new features or selecting the most important ones to improve the model’s performance.
Key Techniques
- Feature selection
- Feature transformation
- One-hot encoding
- Scaling & normalization
- Creating derived variables
Strong features can significantly boost accuracy and reduce model complexity.
6. Model Building (Machine Learning)
At this stage, machine learning algorithms are selected and trained on the prepared dataset.
Common ML Models Include:
- Linear Regression
- Logistic Regression
- Decision Trees
- Random Forest
- Support Vector Machines
- K-means Clustering
- Neural Networks
Model Training Steps
- Train on the training dataset
- Validate using validation or cross-validation
- Tune hyperparameters for optimization
7. Model Evaluation
After training, the model’s performance must be evaluated using metrics suited to the problem type.
Evaluation Metrics
For Classification:
- Accuracy
- Precision
- Recall
- F1 Score
- ROC-AUC
For Regression:
- MAE (Mean Absolute Error)
- RMSE (Root Mean Squared Error)
- R² Score
A model is only useful if it performs well on unseen (test) data.
8. Deployment
Deployment means making the model available to end users or business systems.
Deployment Options
- Web APIs (Flask, FastAPI)
- Cloud platforms (AWS, GCP, Azure)
- Embedded in dashboards
- Integration with mobile or web applications
Example:
A trained churn prediction model could be deployed in a CRM system to alert managers about high-risk customers.
9. Monitoring & Maintenance
After deployment, the model must be continuously monitored to ensure it remains accurate and relevant.
Why Monitoring Is Important
- Data patterns change over time
- User behavior evolves
- New features may be needed
- Model performance may degrade
This step ensures the model stays useful in real-world scenarios.
Why Understanding the Workflow Matters
Learning the Data Science workflow helps students and professionals:
- Develop a structured approach to solving data problems
- Communicate better with stakeholders
- Build reliable and scalable ML solutions
- Understand the real challenges in data-driven projects
- Improve decision-making and project management skills
Mini Quiz: Test Your Understanding
- What is the purpose of the problem definition stage?
- Why does data cleaning take so much time?
- What is the goal of Exploratory Data Analysis?
- Name two evaluation metrics for classification tasks.
- Why is monitoring important after deployment?
Conclusion
The Data Science workflow provides a clear, systematic approach to transforming raw data into decision-making tools and predictive models. By understanding each step—from defining the problem to monitoring deployed models—students and professionals can build stronger, more impactful data solutions.
In our next lecture, we will explore Python for Data Science, covering essential programming concepts and tools used by professionals.